Featured

Baby Bonanza

Can people match parents to their respective children?

Experiment:

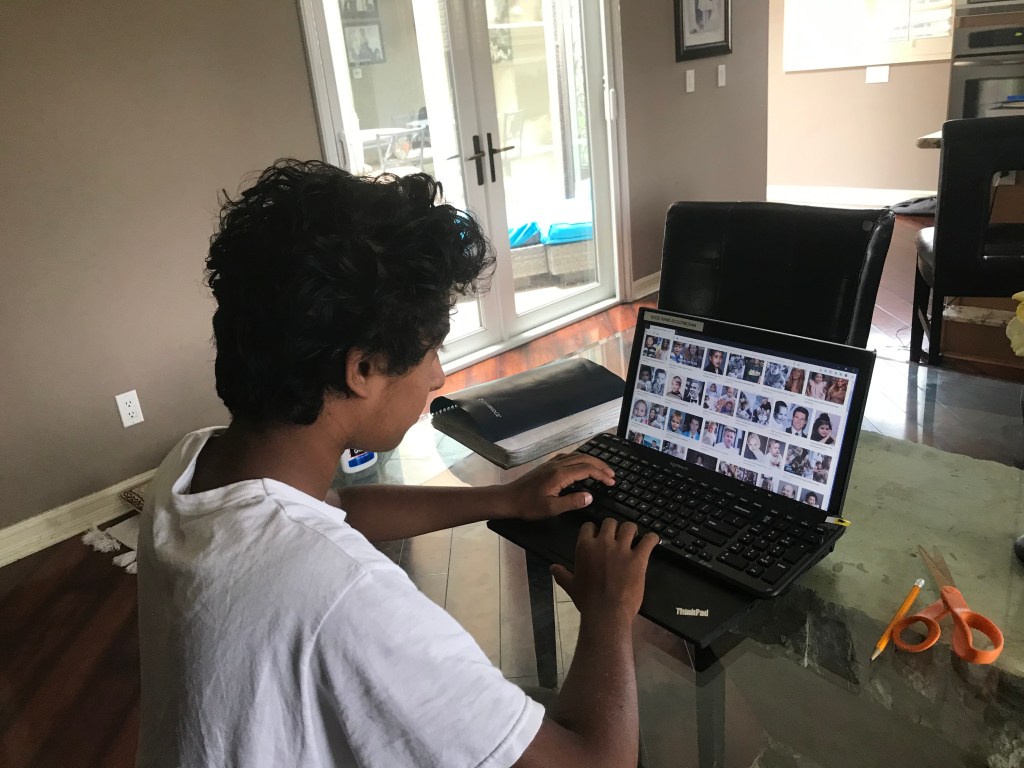
When my parents meet relatives that have recently had children, they often make the same kind-spirited remark: “Oh, you look just like them!” To me, babies look nothing like their parents, until they grow older and grow more defined facial features. My hypothesis is that people can not assign parents to their children based on facial features alone. To test this over the course of the month, both in school, and at home, I created a google form that asked respondents to match a picture of parents to a group of 5 babies, with only one being the couple’s child. Then I would have respondents pick, out of that pool of babies, which baby belonged those specific parents. The strategy I used was finding young pictures of celebrities, then finding that celebrity’s parents. This would make the pictures easier to find, while making sure no one would recognize any of the faces.
undefined

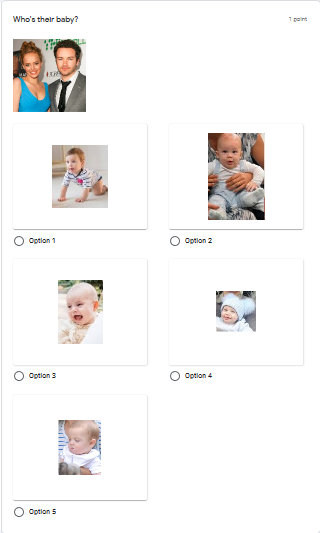
Challenges & Rewards:

Of course, I wanted a significant number of questions to have a large sample size. I decided on 20 questions, with five options for each question. However, this meant that I would have to find over 100 pictures of babies and their parents. Each question had to have babies that could believably be related to the parents. This search resulted in weeks of finding, deleting, and putting together pictures, at school to put on the quiz. I scoured the internet for pictures, cross referencing and making sure I had no repeats I had to make sure the pictures I had were accurate, while also making sure there were no obvious answers. This extreme lapse in productivity soon paid off, because, once I distributed the quiz to my friends and fellow students, I received over 90 responses. This means that overall, that with 20 questions each, I had collected over 1800 data points. A link to the final product is below

Link to the quiz: https://forms.gle/gzTQg7EA76fPRwWy5

Results:

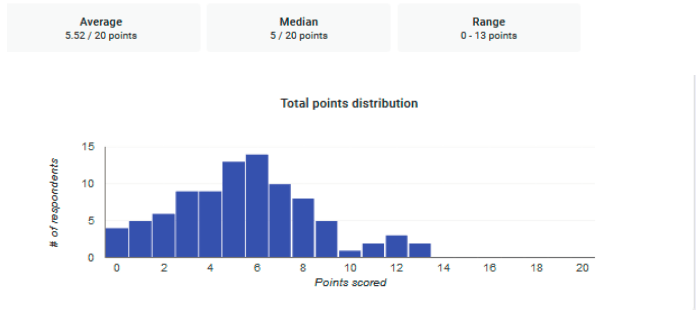
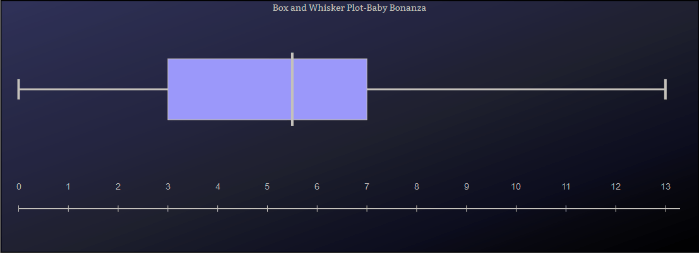
The quiz ended up being spread to all corners of the U.S, from Seattle to New York. It even reached 4 continents, traveling to London, Sri Lanka, and Australia. By the end, I had 91 respondents total. For the hypothesis proposed by my parents to be correct, people should get more questions right than wrong. Therefore, if the average respondent gets more than 50%, or more than 10 questions correct out of 20, my parents will be correct according to this experiment. Out of the 91 respondents, the average number of questions people got correct was 5.52.  By the laws of probability, if you were to simply guess each answer randomly, you would get a score of 4/20, or 20%. Therefore, it is clear that the respondents barely completed the test better than if they were to pick answers at random. In fact, over 25% of the participants received a score lower than if they were to pick at random. The respondents did far worse than the over 10 question benchmark, making my hypothesis, in this case, true. Below one can see the data, in bar graph and box and whisker plot form, as well as other data points.

Conclusion:

So why do we see the similarities in parents and their children when we clearly can’t identify them? The reason traces back to our ancient ancestors. Back then, recognizing patterns in others faces to see if they posed a threat or were likely to cooperate meant life or death. Therefore, we humans got exceptionally good in recognizing patterns in others faces. Being able to recognize and empathize with others helped us build the long lasting civilizations and communities that define modern life. So next time you see your baby cousin, know that you probably can’t tell that she, “..looks just like you!”, but the fact that you can identify and recognize these faces at all is a testament to the incredible power of the human brain.

Do Batteries Work Better in Bad, Blistering Cold?

Do batteries work better in colder environments?

The Plan:

My family has a habit of keeping our batteries in cold environments, or at the least keeping them out of warm areas. Their reasoning for this is that the batteries will last longer in cold environments than in room temperature, and that batteries will work significantly worse in heated environments. However, I disagree. I predict that the he more extreme the temperature that batteries are kept at, the worse they will perform. Batteries kept at room temperature would work the best out of all. Overall, my hypothesis suggests that altering the temperature batteries are kept in will only hinder their performance. At school, I came up with a plan to test this, how I would implement it, how I would control the variables, and how I would the results would affect my hypothesis. I bought a set of 18 identical flashlights that came with identical batteries. I put the batteries in multiple conditions and temperatures, to see if any hinder or help the batteries’ performance. These conditions would be monitored and temperatures recorded over a defined time for all batteries. Then, these batteries would be put in a set of identical flashlights. The performance of each battery would be defined by how long the flashlights shined.

The Pre-Test:

I started with a test run, to make sure our methodology was correct. In this pre-test, we put room temperature batteries in a flashlight. I kept the batteries with me to make sure I knew the exact time it died. The flashlight stayed on for 44 hours. This information helps us address the first main problem. This was that I couldn’t reasonably watch the flashlights all day, and if I were to turn them off while I slept, that time could leave time for the batteries to cool down, jeopardizing the experiment. With the knowledge that the average flashlight would last for 44 hours, I could make sure I spent time watching the flashlights in the correct times. Furthermore, by watching an identical flashlight burn out, I knew what a flashlight that was about to give out looked like. The reason I didn’t use the tactic I had just used of keeping it with me, is because carrying it with me resulted in the flashlights being rolled, and bumped around. In some cases this could make a flashlight that could go for a few more hours, suddenly fizzle out. With this knowledge, I could proceed to the experiment. I placed batteries in the fridge, the freezer,(which both have a temperature display), and an area of my house near the house thermostat. To achieve the heated temperatures I brought back my old friend the incubator. The knowledge I have gained in the past (see 5 sec. Spaghetti Spoil & Testing Tainted Tables) can easily translate to recording the temperature of heating batteries.

Flashlight at hour 40

The Experiment:

I tested batteries in room temperature, heated temperatures, temperatures just above freezing, and below freezing temperatures. From the moment the batteries were placed in their respective environments, I would check and record the temperatures for each environment for 24 hours. The average temperature for the room, heated, above freezing, and freezing temperatures are respectively, 81.5 degrees, 102.2 degrees, 33 degrees, and 0 degrees. After 24 hours had passed the next phase was implemented in which the batteries were placed in identical flashlights. Again the temperature that the flashlights were in was recorded. My family and I worked together (since some of my family members had to wake up earlier, and others chose to stay up late) to mark the temperature each hour, and to check if the flashlights were still on, if possible).

I recorded the temp. for the batteries while they were being held in their areas: Fridge, Freezer, Incubator, and Room temp.

The Results:

The flashlights lasted an astounding 3 and a half weeks! The first of the flashlights to die was the incubator battery. As anyone who has taken their phone out in a hot day in California, heat can extensively degrade a battery, and that was reflected in the results of my experiment. As for the other three, all of the rest died within a few hours of each other, which is not a significant difference. Due to this negligible time frame, it can be said that batteries in room temperature, fridge temp., and freezing conditions all have roughly the same effectiveness at keeping batteries alive. In this case, according to the results of my experiment, both my parents’ and my hypotheses were partially correct: Batteries work best in room, fridge, and sub-zero temperature, while heat can corrode them.

Conclusion:

For those wondering, the reason the batteries in the experiment lasted so much longer than the Pre-Test is for the exact reason I mentioned in the “Pre-Test” section. “The reason I didn’t use the tactic I had just used of keeping it with me, is because carrying it with me resulted in the flashlights being rolled, and bumped around. In some cases this could make a flashlight that could go for a few more hours, suddenly fizzle out”. I thought this difference was profound enough to not have it repeated in my experiment, while being negligible enough that it could be used as a reliable Pre-Test. However, this does not detract from the things we can learn from this experiment. In fact we can learn even more about flashlights. As we have seen, and as I have learned movement, hard falls, being jostled out of place, and flashlights hitting surfaces are the worst thing to happen to batteries. So the real way to keep batteries alive longer? Keep them at whatever temperature you want, other than extreme heat, and just don’t mess around with them. Use them when you need them, and put them in a place or rest when you don’t, and your batteries will live long happy lives. Next month I am planning on testing the statement my parents often make when meeting relatives with children. They say, “Oh you look just like your child”. I am doing an experiment to test this.

Testing Tainted Tables

What substance in a house is the dirtiest (has the most bacteria)?

The Experiment:

My parents advise me to use a paper towel when handling the toilet seat. That made me wonder. Why so much care with a toilet seat, but not as much with other possibly dirtier substances like door knobs or sponges? I set out to test if my parents cautiousness was necessary around the toilet seat- to see if the toilet was really the dirtiest area of the house. My hypothesis was that surfaces that were in contact with other surfaces in dirty environments would be the dirtiest rather than the toilet- surfaces such as doorknobs and sponges. First, in class, I brainstormed the objects in the house that might be the dirtiest, which was often the areas that were touched the most. The surfaces and items I came up with, and subsequently swabbed for bacteria ended up being as follows: a phone, a plate, the countertop, a computer keyboard, a sponge, a doorknob, a light switch, an uncleaned floor, a cleaned floor, and the toilet seat. After all of these surfaces were swabbed and applied to a petri dish it was time to put them in the incubator and wait for the bacteria to grow.

Problems & Solutions:

After a week I observed the petri dishes. When comparing the results there was some confusion. Firstly, there was bacteria growing in the petri dish from the surrounding air while it was being incubated. To control for this we only took into consideration the bacteria that grew along the lines we had swabbed. My mother and I, who both took swabs of the items, designated a pattern we would each swab in. Secondly, my mother and I ended up taking swabs of the items in differing ways. To account for this, when comparing I had to compare a single line of bacteria from each of two petri dishes. Therefore the different swabbing methods wouldn’t change the results. To see the individual dishes, and how the bacteria grew in each one, click the link below:

https://docs.google.com/document/d/1ibtHgXgdsqUJvC8qhy7wypgOv27yjjP3PHHOgQu3SY4/edit?usp=sharing

Results:

In order, the substances we tested from cleanest to dirtiest come in 6 groups. The first group consisted of the control. This was an empty petri dish that was the cleanest because it had no bacteria infested substances in contact with it. The next group consisted of the sponge. The reason the sponge was as clean as it was is most likely because it had anti-bacterial detergent on it. This would have killed any bacteria from the sponge that was trying to grow on the dish. The third group only included the door knob. This was more dirty than the sponge because it didn’t have any germ killing soap, but the reason it wasn’t more dirty is because the door handle is a dry environment. Bacteria are living things and need water to live. The dry door handle therefore didn’t support as many bacteria. The subsequent group was the clean plate. The plate had been washed, but because of it’s wet environment and residual food, it was a relatively good breeding ground for bacteria. The following group contained two items, the light switch and the toilet seat. The light switch had the same amount of hand touching it as the doorknob, but was inside the house giving it a much better environment. The toilet was a wet area that had a substantial amount of human, and fecal matter in contact with it, but the seat was often cleaned. This cleanliness meant that it wasn’t as dirty as the last group on the list. This last group comprised 5 items, Countertop, Computer Keyboard, Phone, Clean Floor, and the Dirty Floor. These had one thing in common: they all were touched hundreds of times on a day to day basis, and 3 of them (Dirty Floor, Phone, Computer Keyboard) aren’t or weren’t cleaned.

Conclusion:

To conclude neither my parents or I was right. Toilet seats aren’t very dirty, but only because we know that they can be. Because we know that toilets can easily become overrun with bacteria we clean them. Even so the other items we think could be dirty because they are handled in dirty environments, like sponges and doorknobs, aren’t because they don’t have the right environment to sustain that bacteria. Truly it’s the items we don’t believe are dirty, which inhabit relatively clean environments, that are most likely to be dirty, like your own phone or computer keyboard. The lesson? Just be wary and safe when it comes to the dirty substances around your house. Clean your phone every once and awhile, make sure your floors are disinfected, and please, no matter what, clean your toilets. The next experiment I will be testing is the life advice my parents use, of keeping one’s batteries cold, to help them last longer.

5 Second Spaghetti Spoil

We have all heard of the 5 second rule.

The Experiment:

Once, I was eating dinner with my family. As the meal wrapped up, we began eating dessert, a bowl of cookies. My  father reaches out to grab one, but accidentally spilled one out onto the floor. With speed, he snatched it from the ground as he shouted, “5 second rule!”. That made me wonder, if one were to pick up a food from off the ground within 5 seconds would it leave the bacteria no time to get on one’s food? Would waiting past 5 seconds bring exponentially more bacteria? I didn’t think so, but I had to test it.

My hypothesis was that the 5 second rule is false, meaning that picking food up before 5 seconds have passed won’t help you avoid bacteria in your food. How would we go about testing this? We would need to see if a piece of food that had been dropped for 5 seconds had less or no bacteria compared to a piece of food dropped for a longer amount of time. I dropped the apples for different amounts of time and compared the bacterial growth. As a control for any existing bacteria already in the petri dish I placed a petri dish with nothing in it in the incubator. As a control for any existing bacteria already in the apple before it had been dropped, I swabbed the apple as soon as it was taken out of the container to incubate. This is the plan I made for this test, while in school. With the control set, I wanted to see if the 5 second rule had more or less of an effect in different areas, so I tested this in 4 separate locations. The first was a wood-paneled floor that had a lot of foot traffic, and hadn’t been cleaned. I labeled this “Dirty Floor”. The next was an area of wood-paneled floor that had almost no foot traffic and had been cleaned. I labeled this “Clean Floor”. Additionally I tested this outside, in an area of dirt which I labeled, “Outside”. Finally I tested this on an area of carpeted floor known as, “Carpet”. I couldn’t only drop food for 5 seconds, because the 5SR states that there won’t be bacteria during 5 seconds, which means that after 5 seconds one can’t eat food off the floor. To test for this I dropped apples on each surface for 5 seconds and for 20 seconds. After all 4 surfaces were completely tested it was time to put them in the incubator and wait for the bacteria to grow. 

“Outside”
“Inside Dirty”
“Carpet”
“Inside Clean”

Results:

With the bacteria grown it was time to compare them to the control. If the 5 second rule was true two conditions must be met. First, the control and the 5 second dish must have roughly the same amount of bacteria. This would prove that almost no bacteria was on the food before it was dropped. Secondly, the 20 second dish must have more bacteria than the 5 second dish. This would prove that waiting long after 5 seconds would result in significantly more bacteria growth. With this link you can see the pictures of the bacteria growth and the conclusions I reached for each surface that was tested. https://docs.google.com/document/d/1uV0coL-jraQwHsE9dJqL6Tt45wjy3Ogfh2elaSEiTOg/edit?usp=sharing

Conclusion:

With two surfaces leading to a positive conclusion and two surfaces leading to a negative conclusion about the 5 second rule, where do we stand? In all of the petri dishes including the control, there were significant amounts of bacteria, and some surfaces like the clean floor, and dirty floor grew more variety in species of bacteria indicated by color and shape. Clearly no matter how hard we try we can’t avoid bacteria. Whether we drop food or not, it will be covered in all sorts of bacteria. However, historically many people have eaten apples, and eaten them off the ground, and the majority of them have not been harmed by the bacteria that we know is on them. With the information I have gathered two conclusions can be made. Because of the ever presence of bacteria, the 5 second rule is likely untrue, making my hypothesis correct. More importantly, it doesn’t matter. As long as you exercise caution, and wash your food if it leaves your table, you will be fine. Next month I will test which substance in my house is really the dirtiest.

5 Second Spaghetti Spoil & Testing Tainted Tables- The Prequel

The Agar:

We bought a petri dish set for these exact types of experiments. The box contained 20 petri dishes, sterile cotton swabs, and agar solution. Agar is a jello-like nutrient mixture that bacteria easily grow on. This agar was dehydrated in the package so we had to mix it with distilled water. The reason we couldn’t use plain tap water is that tap water would have bacteria: not harmful bacteria, but bacteria that would undermine the results of the experiment. We then separated the mixture into two to make it easier to boil. The reason we boiled it was to kill any existing bacteria that was already in the petri dish or the agar, as well as make the agar dissolve better in the solution. We boiled the mixture in the microwave, but we had issues with overheating it. For the second mixture, as we were waiting for it to heat up, with no warning it suddenly started expanding, and the agar solution almost spilled all over the microwave. Next we allowed the agar to cool, and poured it into the 20 petri dishes we had. We then let these cool and harden overnight. 

Stirring Agar
Pouring Agar

The Incubator:

Agar isn’t enough to get bacteria growing to levels large enough to see with the naked eye. I needed to get the petri dishes to a temperature that the bacteria would thrive in. Bacteria typically thrive in temperatures similar to that of the human body: 37 degrees C. I needed an incubator that would keep the bacteria at that exact temperature. At school, I researched the construction and upkeep of a DIY incubator. To make the incubator I used the heat of an incandescent lamp, and trapped that heat in a styrofoam cooler wrapped in a blanket. We originally wanted to use 3 lamps, but the first two we tried were LED, and therefore only emitted light, not heat. We experimented with different configurations of the blanket, lamp, and cooler to get the precise temperature we wanted. We first tried simply the lamp and the cooler, only reaching 30 degrees Celsius. Then we fully wrapped the blanket around the cooler, getting the inside of the cooler to 45 degrees. Finally we partially laid the blanket around the cooler, leaving half of the top exposed. This configuration finally got us around the temperature we wanted 37 degrees. With these two elements in place, in the coming months I will test, the 5 second rule, and other experiment involving growing bacteria

Too much blanket- Too hot for bacteria to live
Not enough blanket- Not hot enough to let bacteria thrive
Perfect amount of blanket coverage- Bacteria will grow
Thermometer inside the incubator- Reading of 100 degrees F, or 37 degrees C

Arranging Aces

Which shuffling method is the most effective?

Experiment:

My dad and I often play games of cards such as “Go Fish”, and “Spoons”, but when we play he uses the common overhand shuffle. He insists that this is the best way to shuffle cards efficiently. However, me and my sister almost exclusively uses riffle shuffling , believing it is the most effective shuffling method. I wanted to scientifically test which of the most common shuffling methods is the most efficient. I would test this by taking a deck of cards in a certain configuration. Then, I mix them using various shuffling methods, to find which one performed the job the best. I would test 4 specific styles of shuffling. The first I would test is the previously mentioned, riffle shuffle. In this method half of the deck is held in each hand with the thumbs inward, then cards are released by the thumbs so that they fall to a surface interleaved. Next, I would test the piling method, in which the top card is placed into the first pile, and the second card in the second. This repeats until the fifth card, which is placed in the first pile, then the sixth card in the second pile and so on. Once the deck is done, stack the piles on top of each other from 1st to 4th. The next method I tested is called the overhand shuffle. This style involves, one gradually transferring the deck from your right hand to your left hand by sliding off small packets from the top of the deck with your thumb. The final style I tested is called the pool method. In this style cards are laid out on a surface and randomly placed into a pile to make a random deck. My methodology to determine whether the cards have moved might seem a little counter-intuitive. Rather than determining how much each individual card had moved in the deck, I grouped cards by suit and determined the amount of disturbance done to each group. The reason for this, in shuffling the goal isn’t to just move cards around, for that would mean that one cut would be the most efficient shuffling method (which it isn’t). Instead shuffling serves the purpose of breaking up groups or patterns in a deck, to provide the cards a sense of randomness. Therefore, we should judge the quality of a shuffling method based how well it breaks up groups.

Proof of Concept Test:

Before I began the experiment I wanted to ensure that my methodology was sound. For this reason I preformed a proof of concept test to see if my experiment would warrant statistical results. For this test, I needed a clear and obvious way to see results so I could easily view a big-picture look at how cards had moved. In order to do this, I used cards from a game (that I do not endorse) called, “Exploding Kittens”. The brightly colored cards, and similarly shaped cards of the game allowed me to easily make four 13-card groups divided by color, and to easily to see any results. Below is 52 cards from the game, “Exploding Kittens” before any shuffling takes place. It is a control to compare any shuffling done after. The first group of 13 cards, meant to be in place of diamonds in a normal deck are made up of red, orange and yellow cards. The next group of 13 cards, meant to be in place of clubs are made up of pink and purple cards. The following group of 13 cards meant to be in the place of hearts are made up of green cards. The final group of 13 cards meant to be in the place of spades are made up of grey, and black cards. With this in place it was time to shuffle and compare the results.

Deck before any shuffling
First group of 13 cards
Second group of 13 cards
Third group of 13 cards
Fourth group of 13

Results:

As for the riffle shuffle, the deck was affected in a significant way. The deck was spit into about 7 large clusters with each clusters having, on average 7 cards. The length of clusters was essentially, split, almost in half due to the riffle shuffle. Furthermore 86% of the cards moved to a new area of 13 cards after they were shuffled. The overhand shuffle, had 9 large clusters, with each cluster having an average of 4.5 cards. Finally, for the pool method there were no significant clumps. In all 52 cards statistically profound groupings of cards formed, and 78% of the cards moved to a new section of 13 cards. These results show that my methodology is solid, and with that information we can continue on to the real experiment. To see the shuffled results of each 4 styles click the link below

https://docs.google.com/document/d/1AZxddD8UBPO23YNTjCAUcbYCFDFvqkNd8CESRnAIE0o/edit?usp=sharing

Overhand shuffle
Riffle shuffle
Piling shuffle
Pool shuffle

Experiment:

Now the difference between this experiment and the proof of concept test are two things. There are more trials, meaning coincidence is less of a variable, and each shuffle will be performed for the same amount of time (except the riffle which will be completed once). Both of these factors will make the test more reliable, and will yield more accurate results. I performed each shuffling style for 50 seconds each. I then recorded any clusters, the average size of those clusters, and how many cards left their suit area(13 card long section in which the suit was before it was shuffled). To see the results of each individual trial use the link below to see a spreadsheet that has just that. This will instead be an overall view of the trials, and what information I have gained from these trials. Let’s begin with the results for Overhand shuffle, the one my father uses. On average, each of my 5 trials had an average of about 5 clusters. This means 5 strings of 3 or more cards, in order. Furthermore, each of these of these clusters had an length of 4 cards. With a large amount, and size of clusters with this method, this style is undoubtedly not optimal. The next style I tested is the Riffle shuffle, the one my sister and I use. On average, this style resulted in 2 clusters with average lengths of 4 cards each. Due to the similar amounts and lengths of clusters, the riffle shuffle is not optimal, but because of the lessened amount of clusters, it is slightly better than the Overhand method. The following method I tested was the Piling method. This method had had 0 clusters throughout the experiment, but a pattern emerged. The same pattern of 3 or 4 spades followed by 3 or 4 hearts then, clubs, and diamonds recurred for each trial. This pattern makes the cards very predictable, which makes this shuffling style the worst out of the 4 I tested. The final style I tested was the Pool method. In this method, there were no clusters, and no pattern emerged. This makes the Pool method undoubtedly the best shuffling method, according to my experiment. This makes both my, and my dad’s hypothesis incorrect.

https://docs.google.com/spreadsheets/d/1nRcLKBBuwcCC7Li94gKX0lVJMlSIepGbzHOdA6ie1A4/edit?usp=sharing

Conclusion:

Since the 9th century card games have been a prevalent element in how humans occupy and entertain themselves. During difficult times in communities games like these have kept societies calm, collected, and unified, and most of all, have kept them happy. Hopefully, the knowledge I have acquired it makes that ancient tradition a little fairer and more fun for all who are involved. In the next post I will prepare the instruments required to perform experiments on bacterial growth.

Blindly Bumbling in Continuous Circles

Does someone with a blindfold on, travel in circles?

Planning:

I wanted to test the comment that my mother made jokingly while I was washing the same dish over and over again trying to get the smudges off.  “You’re doing that so badly it’s like you have a blindfold on. You’re going round and round in circles!” It was a joking remark, but it made me curious: if one were blindfolded would they resort to moving around and around in circles? My hypothesis is that you wouldn’t travel in circles if you were to travel blindfolded. I would test this experiment by having an open area with black-out goggles. These goggles would much more reliably block out the light than a blindfold that was tied around my face that could potentially fall off. In school I made a plan for 2 parts of the experiment. two part involved whether I would walk in circles, blindfolded, or swim circles. CPE is close to my house, which would provide me with a large open space to swim and to walk to test this experiment. My sister would walk behind me using the landmarks around us to tell if I had walked in full circles. She would do the same as I swam. For the walking section my sister would place objects behind me where I had walked to mark my path. We could review these for a more objective way to tell if I had truly walked in circles. In contrast, the limited space and the reality that my sister couldn’t place objects behind me made the swimming section of the experiment much more difficult, and objective according to my sister’s point of view. However, to combat this, all trials of this experiment would be recorded. This footage could be reviewed to paint a clearer picture.

Outside of Blackout Goggles
Inside of Blackout Goggles

Problems & Setbacks:

As you just read, I planned on wearing my blackout goggles to swim blind at CPE. However, this didn’t go exactly according to plan. As we walked in my parents and I became worrisome about keeping a phone so close to the water. We all decided the risk of dropping it while recording me was too high for the experiment. However, we thought that the experiment could still be accomplished. We believed that although the video was a vital objective part of the experiment, the experiment could still be accomplished within reason without it. As we arrived inside CPE, as my sister went off the the side, I prepared to enter on the perpendicular side. This side, happened to be right next to a lifeguard. The lifeguard took, what I only saw as a double-take, a moment of hesitation, and then a stern, yet confused question. “Did you put tape on your goggles?”. My sister, realizing the lifeguard’s imminent lecture and my inability to speak to anyone in authority, came to attempt to explain the situation. She told him about the project, the experiment and why I was wearing the blackout goggles. The lifeguard, slightly less confused, gave us a lecture on how dangerous it was, and how I could hit my head on the wall, or that if I went under, I needed to be able to see. He had a good point, and I’m glad, for my safety, that he said what he said, but me and my sister begrudgingly walked back to the car knowing that half of the experiment was now lost.

Me going to the pool pre-setback
Me coming from the pool post-setback

Procedure & Results:

Although the previously mentioned setbacks meant I couldn’t perform the aquatic portion of the test, we continued and later we performed the land portion of the test as described in the “Planning” section.

When we arrived at the park we were met with a fairly empty field. With a jacket, we marked the starting point that I would begin every trial at. I then used a compass and walked forward for 3 minutes north to provide a target for a perfectly straight walk. We then performed ten 3-minute trials. The reason we didn’t just keep walking until I bumped into something, was both for safety purposes and also as a way to keep each trial consistent. Therefore, every trial in which I bumped into something before the 3 minute mark had to be redone. In none of these trials I reached the completely straight goal. In 2 of these trials I merely drifted off of the imagined straight line, with a only a slightly curved path. In 4 of these trials I made a roughly 90 degree turn off of the target. 3 of these were to the right, and 1 was to the left, indicated no particular bias. Finally, in 4 out of 10 of the trials, I completed approximately a 180 degree turn, facing back in the direction I came. In all of these trials, before taking off my goggles, I believed to some extent that I had walked in a relatively straight line. I couldn’t differentiate between any of the significant deviations between the runs. In this case, according to the results of my experiment, my hypothesis was false, and my parents’ was true: Someone who is blindfolded does tend to walk in circles.

Conclusion:

The difference between blinded and non-blinded walking is fascinating. Small deviations from our mental model of the world, can add up into completely warped perceptions of reality. This experiment shows the incredible, yet fragile power of the human brain. We can learn to do things often thought impossible, yet that same brain can struggle with tasks as simple as walking, when not given enough information. Therefore, to equip our brains to be able to stand against its susceptibility, its egoism, and its fallacies, we must arm it with as much information is possible. Then, and only then can we traverse the complicated and often subjective reality more objectively. In the next post I will scientifically test the best shuffling method.

Design a site like this with WordPress.com
Get started